https://www.sec.gov/Archives/edgar/data/320193/000032019317000070/a10-k20179302017.htm
|
2017
|
2016
|
2015
|
2014
|
2013
|
|||||||||||||||
|
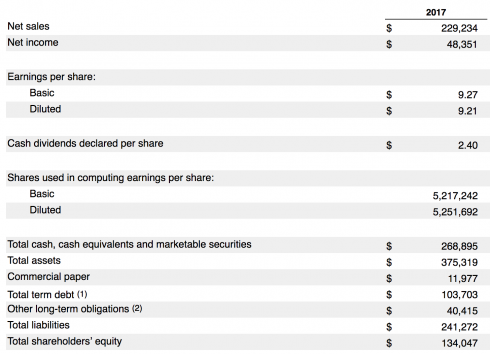
Net sales
|
$
|
229,234
|
$
|
215,639
|
$
|
233,715
|
$
|
182,795
|
$
|
170,910
|
|||||||||
|
Net income
|
$
|
48,351
|
$
|
45,687
|
$
|
53,394
|
$
|
39,510
|
$
|
37,037
|
|||||||||
|
Earnings per share:
|
|||||||||||||||||||
|
Basic
|
$
|
9.27
|
$
|
8.35
|
$
|
9.28
|
$
|
6.49
|
$
|
5.72
|
|||||||||
|
Diluted
|
$
|
9.21
|
$
|
8.31
|
$
|
9.22
|
$
|
6.45
|
$
|
5.68
|
|||||||||
|
Cash dividends declared per share
|
$
|
2.40
|
$
|
2.18
|
$
|
1.98
|
$
|
1.82
|
$
|
1.64
|
|||||||||
|
Shares used in computing earnings per share:
|
|||||||||||||||||||
|
Basic
|
5,217,242
|
5,470,820
|
5,753,421
|
6,085,572
|
6,477,320
|
||||||||||||||
|
Diluted
|
5,251,692
|
5,500,281
|
5,793,069
|
6,122,663
|
6,521,634
|
||||||||||||||
|
Total cash, cash equivalents and marketable securities
|
$
|
268,895
|
$
|
237,585
|
$
|
205,666
|
$
|
155,239
|
$
|
146,761
|
|||||||||
|
Total assets
|
$
|
375,319
|
$
|
321,686
|
$
|
290,345
|
$
|
231,839
|
$
|
207,000
|
|||||||||
|
Commercial paper
|
$
|
11,977
|
$
|
8,105
|
$
|
8,499
|
$
|
6,308
|
$
|
—
|
|||||||||
|
Total term debt (1)
|
$
|
103,703
|
$
|
78,927
|
$
|
55,829
|
$
|
28,987
|
$
|
16,960
|
|||||||||
|
Other long-term obligations (2)
|
$
|
40,415
|
$
|
36,074
|
$
|
33,427
|
$
|
24,826
|
$
|
20,208
|
|||||||||
|
Total liabilities
|
$
|
241,272
|
$
|
193,437
|
$
|
170,990
|
$
|
120,292
|
$
|
83,451
|
|||||||||
|
Total shareholders’ equity
|
$
|
134,047
|
$
|
128,249
|
$
|
119,355
|
$
|
111,547
|
$
|
123,549
|
|||||||||
|
2017
|
Change
|
2016
|
Change
|
2015
|
|||||||||||||
|
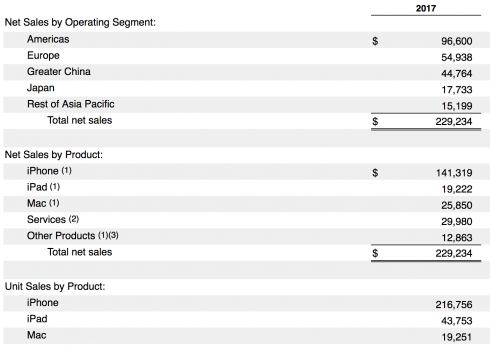
Net Sales by Operating Segment:
|
|||||||||||||||||
|
Americas
|
$
|
96,600
|
12
|
%
|
$
|
86,613
|
(8
|
)%
|
$
|
93,864
|
|||||||
|
Europe
|
54,938
|
10
|
%
|
49,952
|
(1
|
)%
|
50,337
|
||||||||||
|
Greater China
|
44,764
|
(8
|
)%
|
48,492
|
(17
|
)%
|
58,715
|
||||||||||
|
Japan
|
17,733
|
5
|
%
|
16,928
|
8
|
%
|
15,706
|
||||||||||
|
Rest of Asia Pacific
|
15,199
|
11
|
%
|
13,654
|
(10
|
)%
|
15,093
|
||||||||||
|
Total net sales
|
$
|
229,234
|
6
|
%
|
$
|
215,639
|
(8
|
)%
|
$
|
233,715
|
|||||||
|
Net Sales by Product:
|
|||||||||||||||||
|
iPhone (1)
|
$
|
141,319
|
3
|
%
|
$
|
136,700
|
(12
|
)%
|
$
|
155,041
|
|||||||
|
iPad (1)
|
19,222
|
(7
|
)%
|
20,628
|
(11
|
)%
|
23,227
|
||||||||||
|
Mac (1)
|
25,850
|
13
|
%
|
22,831
|
(10
|
)%
|
25,471
|
||||||||||
|
Services (2)
|
29,980
|
23
|
%
|
24,348
|
22
|
%
|
19,909
|
||||||||||
|
Other Products (1)(3)
|
12,863
|
16
|
%
|
11,132
|
11
|
%
|
10,067
|
||||||||||
|
Total net sales
|
$
|
229,234
|
6
|
%
|
$
|
215,639
|
(8
|
)%
|
$
|
233,715
|
|||||||
|
Unit Sales by Product:
|
|||||||||||||||||
|
iPhone
|
216,756
|
2
|
%
|
211,884
|
(8
|
)%
|
231,218
|
||||||||||
|
iPad
|
43,753
|
(4
|
)%
|
45,590
|
(17
|
)%
|
54,856
|
||||||||||
|
Mac
|
19,251
|
4
|
%
|
18,484
|
(10
|
)%
|
20,587
|
||||||||||
Views: 0